After weeks of stepped-up transportation activity to handle sharp spikes in demand, there are new signs that the surge of activity on transportation is decreasing and returning to historic averages. The latest data paint a picture of a resilient supply chain demonstrating strength and stability despite external stresses.
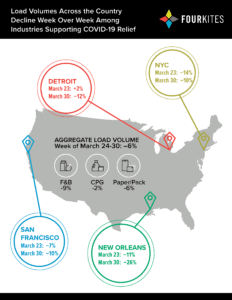
In tracking the supply chain’s response to the COVID-19 outbreak, we examined recent volume trends impacting four of the hardest-hit cities – New York, Detroit, New Orleans and San Francisco – to gauge how those regions’ supply chains were responding. The first three weeks of March saw significant increases in load volumes as these cities registered sharply higher demand and panic buying. Since then, load volumes have declined as the supply chain has returned to demand patterns that are more consistent with what we’ve seen in the past.
FourKites, which monitors dozens of conditions that affect transit times over millions of loads, aggregated insights across nearly 4 million loads in the CPG, food and beverage, and paper and packaging industries. Consider the following weekly load volume declines across those three industries for the weeks of March 23 and March 30, respectively:
Our city-level data is in line with trends we’ve seen across all global shipments. Across all loads, there was an aggregate 6% decrease in load volume the week of March 30 compared to the previous week, with CPG load volume dropping by 2%; F&B loads dropping 9%; and paper and packaging loads dropping 6%. This is in contrast to the 29% increase in volume observed from February to March for those very same sectors – an uptick that reflected the added demands put on the supply chain during the early weeks of the nation’s COVID-19 response. (It should be noted that the demand picture certainly isn’t “normal” by any stretch of the imagination, as manufacturing races to catch up with unusual demand volumes and panic buying patterns threaten future food supply disruptions.)
Over the last week, in addition to evaluating load volume, we also analyzed trip distance, mode composition and carrier concentration to gauge changes in standard supply chain patterns. Outside of load volume fluctuations – which are returning to normal levels – there has been no observable change in those trends. When it comes to the average distance a load travels from origin to destination, for instance, we found no significant change. Over the past six months, average distance for shipments in the F&B, CPG, and paper and packaging industries remained relatively consistent, averaging between 470-510 miles per load.
As we’ve previously noted, there has been some disruption at the facility level. That shouldn’t come as a surprise given that the sudden eruption of the COVID-19 crisis left supply chains with little time to plan, forcing them to scramble in reaction to sharp changes in the market. Although warehouses can typically stretch to 110% of normal capacity with limited negative impact, they are now being stretched significantly more. That translates into more product to pick up, more potential for manufacturing delays, and more trucks in the queue to process.
FourKites analyzes data from millions of loads and real-time machine learning to help shippers and carriers optimize their assets and inventory movements. Stay tuned for additional FourKites insights, as the impact of COVID-19 on global supply chains continues to unfold in the weeks ahead.